

The Economic Aspect of Ecoforestry
By: DR. HANS BURKHARDT
This article first appeared in the International Journal of Ecoforestry in the spring of 1996. It is excerpted and reprinted on our website with permission from the author, Mr. Hans Burkhardt, Ph.D. While he was alive, Mr. Burkhardt was closely affiliated with OGA and his research is a guiding principle of OGA's field work.
For anyone who is at all aware of our planetary ecological condition, it is starkly clear that our society must stop its current suicidal mode of action, and we must find more sustainable ways to live and do business. While it is critical that we make sweeping changes in several areas, such as population reduction, over-consumption and fossil fuel use, my purpose is to focus on one critical area - our relationship to the native forest resource.
My intention here is to give information that can be adapted and applied anywhere by people who wish to know how one can restore and sustainably use depleted forest resources. I make my recommendations with deference to economic considerations, because in our money-driven society it is economic viability that will bear strongly on the success or failure of whatever changes we plan to bring about. Consensus opinion assumes that high monetary profits from our forests and good ecological protection are mutually exclusive. However, it is my conclusion, drawn from closely investigating several examples of sound forest management as well as my own experience derived from restoring an inventory-depleted forest, that we can have both: what is good for the survival of the forest is good for the well-being of local communities if only we are patient and wise enough to create such a condition.
Tree growth can be divided into three phases:
- The first phase is characterized by very high, rapidly declining percentage growth but negligible volume production. For example, a pencil-thin tree may double in volume in one year, but the volume added amounts to very little. (Growth rates of 100% declining to about 7%.)
- The second phase is characterized by lower, gradually declining percentage growth, high volume growth and ends when average annual volume growth culminates. (Growth rates declining from about 7% to 2%.)
- The third phase is characterized by continued declining percentage growth and a slowly decreasing high volume growth. (Growth rates below 2%.)
All conifers continue to grow substantially in the third phase, some more and longer than others. Redwoods and cedars increase volume considerably for many hundreds of years after reaching culmination of average annual volume growth (CMAI, culmination of mean annual increment.) Also— and this is most important— all tree species show a significant increase in the quality of their wood during the slower, post CMAI phase of growth. This period— when the forest becomes mature— is also the most important for the creation of high inventory and forest sustainability. For the perpetuation of California's redwood forests, this third phase is especially important since it is needed to allow for natural regeneration and thus continued genetic adaptation to changing environmental conditions. Therefore, if native forests are to be used for perpetual timber production, it is imperative, for reasons that include maximum long-term revenue flow for the owner and the local community, not to eliminate this lucrative component of all native forests.
Current North American forestry practice, with few exceptions, does indeed eliminate this third, most important phase of tree growth. And worse, not only are those older trees being systematically eradicated, but even much younger trees— trees in their most active, pre-CMAI period of growth— are routinely harvested under the current practices of industrial forestry. This level of overcutting has finally made the ongoing destruction of our native forests clearly apparent to everyone who is concerned with our own and other species' survival.
There is a way to harvest trees for human use that can both increase the future productivity of these depleted forests and at the same time allow them to regenerate and restore themselves. We must do two things. We must harvest, for a considerable length of time, less than is growing, and we must adjust the harvest rate to maintain high inventories of trees in the forests once they are restored. For the few remaining forests not yet damaged by unwise human interference, we need only maintain high inventory, which can be accomplished by harvesting a certain percentage of inventory, as I will explain later.
A study was conducted designed to simulate various levels of harvest projected into the future to predict the effects on both the sustained health of the forest and its long-term economic productivity. For reliable predictions of future forest growth, one must use the appropriate yield table available, which shows the volume per acre that is likely to be produced for each age class (decade) at a given site. For this study, the yield table produced by Lindquist and Palley (L&P) in 1963 for typical, fully stocked second-growth mixed conifer redwood forest was used as a basis. However, to account for site degradation due to post 1963 liquidation logging, a reduction in yield table was necessary: productivity data from a 1985 Federal Inventory Assessment study led to the conclusion that this could be achieved by lowering site quality from average site index 160 to site index 140 (see yield table on page 30). The actual degree of site occupancy or stocking must also be considered. In this study the average values found by the 1985 Federal Inventory Assessment study were used (55%). In addition, to consider the growth lowering effects of long-term inventory depletion as well as growth favoring effect of long-term inventory increases, yield table values of 50% and 60% respectively were used instead of 55% for both types of scenarios.
HARVEST SIMULATOR
STARTING INVENTORY: 8,000 BOARD FEET (BF), YIELD TABLE: L&P SITE INDEX 140 X 50/60%1
| POI2 | Inventory per Acre (at FR)3 | Age of Oldest Trees Harvested (at FR) | Harvest Level per acre/year (at FR) | Harvest Value per acre/year (at FR) $ per BF4 | Type of Forestry Practiced5 | Sustainability of Resource6 |
|---|---|---|---|---|---|---|
| 6.0 | 4,500 | 43 | 270 | 270 | IF | 00.75 |
| 4.5 | 8,400 | 57 | 378 | 378 | IF | 01.77 |
| 2.0 | 34,500 | 108 | 680 | 680 | MSP | 17.00 |
| 1.0 | 67,500 | 195 | 675 | 1012 | EF | 67.50 |
| 0.9 | 72,200 | 215 | 650 | 975 | EF | 80.00 |
Actual yield table figures are reduced to account for the depleted condition of the forest soil and the inventory stocking levels. 50% is used when inventory is further reduced. 60% when inventory is increased (see text).
One special problem with the yield table used was that there are no second growth stands of redwood older than 120 years in existence. Therefore values had to be constructed by extrapolation of the L&P growth curve and comparison with other conifer growth curves that include the higher age classes. The resulting yield values are presented in page 40 in the Yield-MBF/acre column.
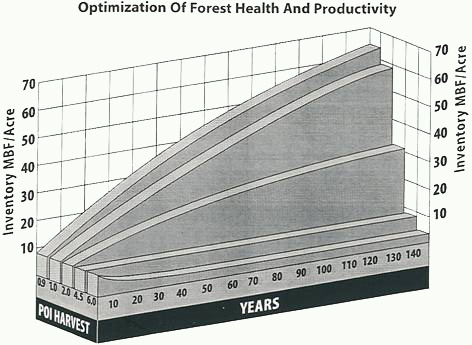
To simulate forest growth, various percentages of standing inventories were harvested. This principle is called percent-of-inventory (POI) harvest control: forests are harvested every decade at a chosen rate of inventory eventually develop an age-class structure that includes all age classes up to rotation age. Regardless of the initial age-class distribution and growth rate, a forest which is harvested at a specific percent of inventory will eventually grow exactly at that rate. When the forest has reached this condition it is fully regulated. Harvest percentages can be chosen that characterize good or bad forestry, percentages that will result in plenty of age classes, or just a few.
It is important to note that average percentage growth rates higher, not lower than those that result in maximum productivity (about 2%), lead to sacrifices in both productive capacity and forest sustainability.
From the yield table being used, one can calculate average percent annual growth up to and including any given age class (decade) by simply dividing the total volume listed for this age class by the sum of all listed age class volumes and multiplying the result by 10. For most conifer forests the world over, the average growth rate that results in maximum productivity (CMAI) at full regulation is close to 2%. To arrive at the harvest rate that leads to the highest value of yield at harvest (culmination of revenue flow) 1.0% and 0.9% harvest rates had to be used. These harvest percentages are compared with those presently being practiced by industry in our area: the two largest local timber companies, Louisiana Pacific (L-P) and Georgia-Pacific (G-P) corporations in their long-range sustained yield plans anticipate harvesting at annual rates of 4-6 percent of inventory in the near future. While L-P anticipates dropping their annual harvests to 1-3% of inventory in the very distant future, G-P anticipates a 4.4% harvest rate until the year 2100.
Therefore, for this study, the forest was "harvested" at five annual rates of POI (6.0, 4.5, 2.0, 1.0, 0.9) until growth rates approached harvest rates (full regulation). This can be done by either simple mathematics or by using a suitable computer program. (For instance "Harvest II" is described in the book Maximizing Forest Productivity*.) Using this procedure, values for inventory, age of oldest trees, productivity and annual harvest were obtained for each scenario. Also assigned is a much-needed value for forest sustainability, which is defined as regulated MBF/acre inventory (= available biomass) divided by the annual percent of inventory harvest (= removal of biomass). The higher the regulated inventory and the lower the annual POI harvest, the higher is the degree of forest sustainability. The accompanying three-dimensional graph and table summarize the most important results of this analysis.
The major conclusions which can be drawn are:
- Revenue flow culminates at a harvest level of approximately 1% of inventory per year (POI 1).
- Productivity measured in board feet (international 1/4" rule) culminates at a harvest level of approximately 2% of inventory per year (POI 2).
- Forest sustainability at the levels investigated is highest at 0.9% of inventory per year (POI 0.9).
- Unsustainable and low present revenue flow (POI 4.5 and 6) could gradually be increased by a factor of 2 to 3 and become sustainable at the same time if a lower POI is used (POI 2, 1, or 0.9). Community impoverishment would slowly but steadily be replaced by community well being. Forest product quality would gradually change from poor to excellent, and forest related jobs could be increased by 180-250%.
- The average time needed to fully restore our depleted forests' productive capacity and health is about equivalent to the time it took to liquidate inventory and damage forest health: one to two centuries.
- Industrial forestry, which maximizes short-term profit, leads to annual harvest levels greater than 3 percent of inventory. The consequences of this practice are loss of the following: inventory, productive capacity, potential tax base, permanent jobs, timber quality, community stability, biodiversity and substantial long-term landowner income.
- The requirements of Ecoforestry can only be fulfilled at an annual harvest level of 1% of inventory or lower. All other harvest levels reduce too much of the richness, biodiversity and sustainability of the forest.
- Forest sustainability increases fourfold if the forest is managed for maximum revenue flow (POI 1) rather than maximum yield in board feet (POI 2).
- Practice of POI 1 harvest control (forest management aimed at maximizing revenue flow) leads to the creation of a secondary forest of near old-growth characteristics, where all age classes are uniformly distributed and the oldest trees are about 200 years old.
In conclusion, one can see that high perpetual revenue flow and good environmental protection are not diametrically opposed. On the contrary, up to the point of maximum revenue flow at approximately the POI 1 harvest level, both seemingly opposing goals of forest management actually improve in synchronous harmony. Harvesting 1% of inventory is the best long-term investment policy for the general public, the local community, the landowner and the forest, when that forest is to be used for timber production while maintaining its ecological integrity.
View a PDF of the Original Publication here, with Mr. Burkhardt's article on Page 11.
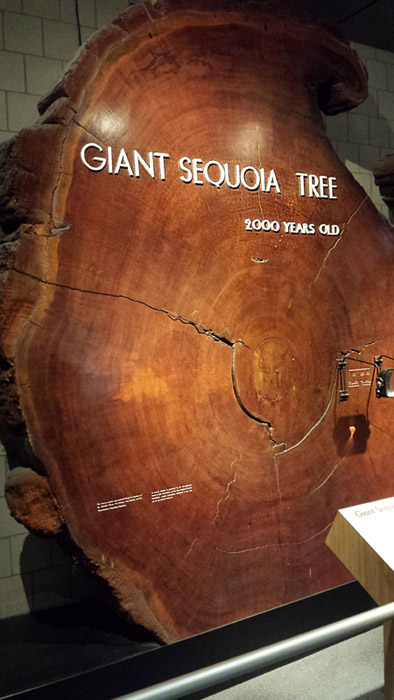
GIANT SEQUOIA TREE
2000 yeard old giant sequoia tree at Museum of Science Driveway of Boston.